Fundamentals and Practices of Sensing Technologies
by Dr. Keiji Taniguchi, Hon. Professor of
Xi’
an
Dr.
Masahiro Ueda, Honorary Professor, Faculty of Education and Regional Studies
Dr.
Ningfeng Zeng, an Engineer of Sysmex Corporation
(A
Global Medical Instrument Corporation),
Dr.
Kazuhiko Ishikawa, Assistant Professor
Faculty
of Education and Regional Studies,
[Editor’s Note: This paper is presented as Part XV and is the
final installment of a series of sections from the new book “Fundamentals and
Practices of Sensing Technologies”]
Chapter 7 Biomedical Sensors
Summary
In this
chapter, principles of biomedical sensors are described: in section7.1,
measurements of
human pulse waves; in section 7.2, measurements of hemoglobin; in
section 7.3, measurements of blood glucose levels; in section 7.4, detections of blast
cells in blood; in section 7.5, measurements of body fat; in section 7.6, urinary
component detections; and in section7.7 sensors for
health management support
system.
7.1 Measurement of Human Pulse Waves
7.1.1 Human Pulse Waves
 Pulse diagnosis, as shown in
Fig. 7.1, is one of the Chinese traditional diagnoses, which also includes a
visual examination and a health interview. The pulse diagnosis is the most
important and traditional diagnostic method. Yin and Yang, Truth and Falsehood,
for organs in the human body (which are parameters of the health states defined
by Chinese medicine) may be known by feeling the pulse based on Chinese
traditional medicine, as shown in Fig. 7.1. Some diseases may, further, be
predicted nowadays with the help of a diagnosis based on the speed, strength
and rhythm of the pulse.
Pulse diagnosis, as shown in
Fig. 7.1, is one of the Chinese traditional diagnoses, which also includes a
visual examination and a health interview. The pulse diagnosis is the most
important and traditional diagnostic method. Yin and Yang, Truth and Falsehood,
for organs in the human body (which are parameters of the health states defined
by Chinese medicine) may be known by feeling the pulse based on Chinese
traditional medicine, as shown in Fig. 7.1. Some diseases may, further, be
predicted nowadays with the help of a diagnosis based on the speed, strength
and rhythm of the pulse.
The most important aspect of this method is that
pulse diagnosis provides a non-invasion measurement and imposes no pain on the
human body. This section introduces
a sensor for the pulse wave, a tool which is becoming more and more popular and
is being applied in preventive medicine.
Fig.7.1 Pulse Diagnosis
7.1.2 Principle of Measurement of
Pulse Waves
A sensor being used to measure the blood
circulation of a fingertip is shown in Fig. 7.2. The blood circulation here
represents that of the whole body because in the fingertip the blood that is
pumped from the heart turns around. The fingertip, therefore, is a very
effective place to measure blood circulation.
Fig. 7.2 Measuring blood circulation by a sensor
The
measuring method is shown in Fig. 7.2. A near-infrared light from a LED irradiates a fingertip. A part of
the light penetrates into the fingertip and is scattered in the capillary blood
vessels. The scattered light is then received by a light-sensitive sensor (Photo diode).
The near-infrared
light with a wavelength between 0.7 and 2.5 μm has properties similar to
visible light.
Power supply unit
![]()
![]()
![]()
![]()
Amplification Section A/D Converter
Light Emitting Diode![]()
![]()
![]()
![]()
Finger-chip
![]()
![]()
Fig.
7.3 Block diagram of the measurement of blood circulation
A block diagram of the
measurement of blood circulation is shown in Fig.7.3. The electrical signal
obtained from a light-sensitive sensor for detecting pulse waves is amplified
by the amplification section. The amplified
signal is, then, converted into a digital signal by an analog-to-digital (A/D)
converter. This
digital signal is, finally, carried to a personal
computer.
The personal
computer records every one beat of the capillary blood vessel and then
calculates the time progress of the blood circulation. An acceleration pulse
can be processed instantaneously by using special software. Diseases can,
finally, be predicted by using a graph of the recorded data, as shown in Figs.
7.4 and 7.5(1).

Fig. 7.4 Pulse waves

Fig. 7.5 Acceleration pulse wave (Second-order derivative)
7.1.3 Relationship between Pulse Waves and Age of Blood Vessels
The relationship between the pulse
waves and aging is evaluated as follows.
Fig. 7.6 Waveform of the acceleration pulse waves
A waveform of the acceleration pulse waves is shown in Fig. 7.6. The
parameters a, b and c can be measured. The tendencies of the changing values
are known from many samples of pulse waves which are obtained from different
age people. As a result, the values
of a and b may be getting smaller, the values of c may be getting larger, when
people are getting older. Based on
the parameters of the waveform, an index which is created to evaluate the
health state of blood vessel, the index (IBV) is calculated by the following
formula.
IBV = (-b+c)/a
The relationship between the IBV and ages is shown in Fig.7.7. This result was
obtained from a group of men. Because there is a
strong correlation between the IBV and ages, the correlation can be used to examine the state of
health.
IBV
Ages 70s 60s 50s 40s 30s 20s 10s
Fig. 7.7 Relationship between IBV and ages
7.2 Measurement of the Hemoglobin
7.2.1 Hemoglobin (HGB)
Hemoglobin (abbreviated HGB)
is the iron-containing oxygen-transport metalloprotein in the red
blood cells of
human, the structure of hemoglobin is shown in Fig.7.8. The protein makes up
about 97% of the red cell’s dry content. Hemoglobin transports oxygen from the lungs to the rest of the body, such
as to the human brain, muscle and organs, where it releases the oxygen for cell
use.
Fig. 7.8 Structure of Hemoglobin
HGB is composed of a pigment called hem
and protein called globin, so it is called hemoglobin.
7.2.2 Relation between HGB and Human
Health
The normal value of hemoglobin in
Men
13.0〜16.6g/dl
Women
11.4〜14.6g/dl
Pregnant women, old people,
children tend to be low. The normal values are different in different countries
and areas.
When the hemoglobin of the
required amount is not enough, the transportation of the oxygen is not enough.
It may cause fast heartbeat to fasten the circulation of the blood and
makes the person out of breath. Furthermore,
the people probably suffer from various anemia such as sideropenia anemia,
aplastic anemia, hemolytic anemia, and chronic bleeding-related anemia or
leukemia.
A HGB measurement is, therefore, very
important to human health so that it is a regular item of health examination.
It also is very important to measure the health condition of the athlete.
Here, two methods for HGB measurements
are introduced.
7.2.3 Principle of HGB Measurement
A. SLS Hemoglobin Method
SLS ( Sodium Lauryl
Sulfate) hemoglobin method is a method for HGB measurement.
Whole Blood Hemolytic reagent
![]()
![]()
![]()
![]()
Photo diode Photo
Sensor HGB cell
![]()
![]()
![]()
![]()
![]()
Fig. 7.9 Simple
structure for measuring SLS-Hb
The
red blood cell is hemolyzed by interface activity action of SLS( Sodium Lauryl
Sulfate C12H25SO4Na)and hemoglobin is
released. A change of the three-dimensional structure happens, and Fe3 + of the
hem is generated as the hydrophobic group of SLS is combined with globin in the
oxidation hemoglobin. Fe3 + is combined with a hydrophilic group of SLS since
Fe3 + has not binding capacity with oxygen. In the same time, oxygen is released,
and SLS-Hb is generated immediately.
As shown in Fig. 7.9, the light of wavelength
550±15nm (or 540±5nm) from a photo diode
passes through a glass filter and then penetrated through the HGB cell, and finally, the rest of light is received
by the photo sensor in the other side. The transmitted light is changed into
electric current. If the stronger current is obtained, it means the lower
density of the SLS-Hb.
The measurement flow is
described as follows:
In the first step, the HGB cell is washed and
cleaned.
In the second step,
the bland value (B_value) is measured, where there are nothing in HGB cell
after being cleaned.
In the third step, the whole blood is mixed with SLS and dilute
solution.
In the fourth step, the mixture is agitated
for a while.
In the fifth step, the mixture value
(SLS-Hb_value) is measured in HGB cell.
In the final step, HGB is calculated by using the following expression.
HGB_value =
SLS-Hb_value - B_value
Those steps
can be done automatically by using sequence programs.
B. Non-invasive Method
(A) Near-infrared
Spectroscopic Imaging Method
The Near-infrared
Spectroscopic Imaging Method is based on the light absorbance feature.
Fig. 7.10 Structure of measurement
Fig. 7.10 expresses the
measurement setup. Near-infrared light is used as a light source. The light
passes thought a human finger and an optical lens. An image can be captured by
a CCD camera on the other side.
The position of peripheral vessel is recognized automatically after analyzing the image. The HGB
can be estimated based on the light absorbance and thickness of blood area. The
good correlation between this method and SLS-Hb method which is
described in session 7.2.2 has been obtained.
(B) Selection of Light
Source
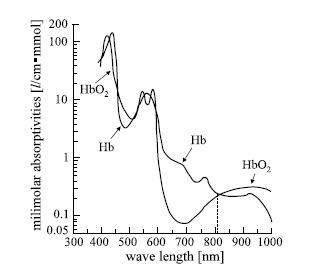
Fig. 7.11 Feature of absorbance
Because the HGB value
includes both of Hb and HbO2, both of them are needed to be
measured. The feature of absorbance
of Hb and HbO2 are shown in Fig.7.11 (2). The milimolar
absorptives of oxygenated and deoxygenated hemoglobin are almost the same, when
the wave length 805nm is applied. By using this light source, it is easier to
discriminate the HGB from others in CCD image. On the other hand, the density
of HGB in CCD image is not changed, even the proportion of Hb and HbO2
is changed. Furthermore, this wavelength is good enough to penetrate human
fingers from a lot of experiments. Therefore, wave length 805nm is selected for
HGB measurement.
(C) Data Processing Algorithms
Here,
an algorithm for the estimation of Hgb is described.
Fig. 7.12 The procedure to obtain the information
of vessel for Hgb estimation
Fig. 7.12 shows the procedure to obtain the information on the vessel
of a human
finger for Hgb estimation.
A human finger is
radiated by the near infrared light. The difference between the finger tissue
and vessel can be obtained by the image on a CCD camera placed on the other
side as shown in Fig. (a), since the light transmission rate for vessel is
different from the rate for finger tissue. The Hgb can, then, be estimated from
this image by means of the intensity and absorbance, as follows:
HGB ≒ K・h/wn
where h and w are calculated
from absorbance distribution in Fig. 7.12, and the coefficient of K and n are
obtained from the experiments.
(D) Result for Hgb
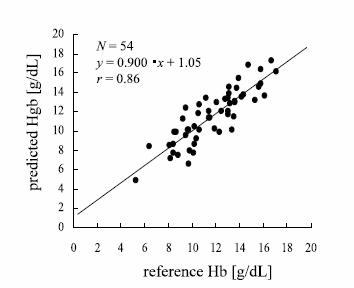
Fig. 7.13 The correlation between the predicted
values obtained
from the non-invasion and the SLS_Hb
The result
is shown in Fig. 7.13(2). A good correlation was obtained between
the predicted hemoglobin concentrations using this method and the reference
values obtained by the SLS hemoglobin method using an automated blood cell
counter (r=0.86, n=54). These results show that this noninvasive
method can be applied to estimate the value of Hgb. It can, further, be used as
a noninvasive method for anemia screening since this method has the advantage
of not requiring blood sampling and no pain to human.
7.3 Measurement of Blood Glucose Level
7.3.1 Blood Glucose Level
Blood glucose level is also called blood sugar level.
Glucose levels rise after meals
for an hour or two, and are usually the lowest in the morning, before the first
meal of the day. The level of glucose usually changes as shown in Fig. 7.14

Time
![]()
![]()
![]()
Fig. 7.14 Change of the glucose level of a day
The measurement of
glucose level can be used for a diabetic screening. And it is very important parameter for
the determination of metabolic syndrome.
Diabetes is a chronic disease that affects the body's ability to
produce or respond to insulin, the hormone that allows glucose to enter the
body's cells and be stored or used for energy. Many diabetics require insulin
injections, and all must carefully monitor and manage their blood glucose
levels. Therefore the measurement of glucose level is very important. Here two
methods are introduced.
Fig. 7. 15
Diagnosis criteria of WHO for diabetes
7.3.2
Principle of Measurement of Blood Glucose Level
A. Invasive Method
(A) Principle of
Invasive Method
There are many methods
that can be used for glucose measurement, Here, an enzymatic electrode method
is described. The advantages of this method are listed as follows:
1.
Even there is no oxygen, the measurement
is possible.
2.
The measurement does not depend on the
special reagent, if there are
the enzyme and the electron mediator,
the measurement can be done .
3.
This method is easy to operate and
maintenance.
4.
Only micro amount sample is needed.
Therefore it can be used as
self-monitoring of blood glucose (SMBG).
The
structure of glucose sensor is shown in Fig. 7.16, there are two different electrodes, above the electrodes,
there is reagent sheet, where is used for putting a measurement sample of
blood. The procedure of measurement
is shown in Fig. 7.17.

![]()
Fig. 7.16 Structure of a
glucose sensor
GOD


![]()
![]()
Fig.7.17 Procedure
for the measurement
The
reaction(3) of measurement principle is shown in Fig. 7.17.
There are an electrode, and counter
electrode as shown in Fig.7.17. In the head of the electrode, there is a
mixture of GOD(Glucose Oxidase), which is shown in the enlarged part of Fig7.17
and ferricyanide. First, when glucose is put into
the mixture, then the glucose and ferricyanide are
changed into gluconic acid and ferrocyanide ions through GOD by a
specific reaction. The reaction also is described in the following chemical
equation(1) .
Second, when a constant voltage is
applied, it reduces ferrocyanide ion into ferricyanide ion (The reaction
also is described by the following Formula(2)) and an electric current is
generated. This current is proportional to the level of the glucose. So the current can be used
for measurement of glucose.
![]()
Glucose + 2[Fe(CN) 5]3- à Gluconic
acid + 2[Fe(CN) 5]4-
(1)
2[Fe(CN) 5]4- à
2[Fe(CN) 5]3- + 2e- (2)
(B) Response
Feature
The relationship between the current of sensor response and the level of
glucose is shown in Fig.7.18.
Glucose (mg/dl)
Fig. 7.18 Response feature of glucose measured by using enzymatic electrode method
B. Minimal-invasive Method
Because
enzymatic electrode method is need some blood sample which are described in
last section, it causes pain or mental pain by using the puncture and there are
risk of infection. Here, a minimal-invasive method is described in this
section.
(A) Principle
of Minimal-invasive Method
This
method(4) is not measured the glucose from blood but is measured
from tissue fluid under the horny layer. Because there is a good
correlation between the glucose level from tissue fluid and that value from blood. As
shown in Fig.7.19, there is slight fine needle array which is put above the
horny layer, so a group of
microporosity passes is formed, after a short time later, the level of glucose
can be measured by using a high sensitive sensor. The current of sensor is converted into
a digital signal using A/D converter. Then the data are processed by using a
micro-processor. Finally, the result is shown in a display.
Fig. 7.19 Structure of the mimimal-invasive
measurement for the glucose level
(B)
Experiment Result
Here is an experiment result
from 20 healthy people obtained by using the mimimal-invasive method.
・Repeatability is
CV=4.9±3.8%
・Correlation coefficient R between this method
and enzymatic electrode method is
0.904.
7.4 Detection of Blast Cells in Blood(5)
7.4.1 Blast
Cells in Blood
A Blast cell is an unripe blood cells
before being brought up normally in bone marrow which is also called as a hematopoietic organ.
Usually, Blast cells do not appear in
peripheral blood of healthy people before they grow up. If the blast cells appear in peripheral
blood, the person is suspected as having leukemia.
The mature processes of blood cells of
two examples are shown in Fig.7.20. One is a kind of white blood cell which is
called an acidocyte, the other is a red blood cell. Therefore, the measurement
of blast cell in peripheral blood plays a very important role in diagnosing
disease.


MyeloBlast
Red blood cell

![]()
![]()
![]()

Fig.
7.20 Mature processes of blood cells
(Those cells are cited from http://plaza.umin.ac.jp/ の WEB PHYSIOLOGY)
7.4.2 Principle of detection of Blast Cells
(A) Semiconductor Laser Diode
Nowadays, because the laser diode has specific
features of which it is hard to diffuse, and its light is able to arrive to a
long distance, furthermore, it is the low cost, and the low energy requirement,
the laser diode is popularly applied as a light source of many sensing
machines.
Here, the laser diode of the wave length of 633(nm)
is applied for the flow cytometry.
(B) Flow Cytometry for Detection of Blast Cells
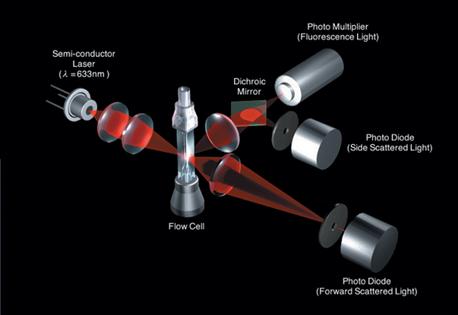
(a) Three dimensional illustration of a flow
cytometry
(This figure is cited from Sysmex Journal Vol.29 2006)
![]()
![]()
(b) Side view of the flow cytometry
(c) Top view of the flow cytometry
Fig. 7.21 Structure of the flow cytometry of automatic hematology analyzer
The
structure of the flow cytometry for detecting blast cells is shown in Fig.7.21.
A 3D
structure of the flow cytometry is shown in Fig.7.21 (a), and the enlarged flow
structures of side view and top view are shown in Fig7.21(b) and Fig7.21(c),
respectively.
A front
scattering light, side fluorescence light, and side scattering light can be obtained. The front scattering light is
usually used for getting the information of size of cells, the side scattering
light is used for getting the shape, density of cells and determination of
existence of granulation on the surface of cells, and the side
fluorescence light is used for getting the information of the quanta of DNA and
RNA.
Here, a scattering diagram is used to
determinate the blast cells. The information for the scattering diagram is
obtained from the front scattering light and the side
fluorescence light as shown in
Fig.7.21. Based on many experiments and using many samples, the blast area can
be detected as shown in Fig7.22.
However, only this scattering diagram is not enough, because some other
substances such as atypical lymphocytes may also appear in the same area of
this diagram. In order to get better information of blast cells, RF/DC
detection method is also applied for detecting the blast cells at the highest
precision.
It
is introduced in the next session.
Front scattering light
![]()
Fig.7.22 Scattering diagram for blast cell
detection
7.4.3 RF / DC Detection Method
Fig.7.23
Structure of RF/DC sensor
As the principle of RF/DC method is described in
chapter 1, see in Fig. 1.4.
The size of the nucleus in the cell or density
of the cytoplasm reflects a state of the cell inside and change. Based on the two parameters, a diagram
is created as shown in Fig. 7.24.
![]()
Fig.7.24 Scattering diagram of blast cells obtained
from RF / DC method
By using many samples, the area of blast cells
is detected as shown in Fig.7.24.
7.5 Measurement of Human Body Fat
7.5.1 Relation between Body Fat
and Human Health
There is a new word which is called “metabolic domino” for
describing the relation between body fat and human health. It means the body
fat or obesity which can cause a chain reaction
associated with many kind diseases as shown in Fig.7.25. The obesity is a condition
in which too much body fat has accumulated. When a person is in this condition,
it will lead to high blood pressure and insulin resistance. Then, it will lead
to hyperlipidemia and diabetes. Finally, it may lead to cardiovascular disorder,
blindness and dementia. Therefore, the monitor and control of body fat play an
important role in preventing many diseases.
![]()
![]()

![]()
![]()


![]()
![]()
![]()
Fig.7.25 Metabolic domino
There are different kinds of methods to measure the body fat, such as
BMI method which is defined by many obesity associations, ultrasonic method, density method, DXA method, TOBEC method, CT method, MRI
method, and so on.
Because there are some limitations of those methods, they are not
convenience to be used. Here, a BIA (Bioelectrical
Impedance Analysis)
method is introduced. Because it is the most
simple, rapid and non-invasive, so this method gets popularity.
7.5.2 Bioelectrical Impedance Analysis Method
A. Relationship between Impedance and
Body Fat
When a low level electric current is
flown the human body, there is no danger to human being, and the impedance can
measure. If there are more the water contained in a body, the current is easier
to flow, because the internal water is a good conductor, an electric current is
easy to flow. If there is much quantity of water contained in a body, and
electrical resistance becomes smaller.
If there is a lot of
body fat in the body, conductivity become smaller, so the value of impedance
gets higher. In the case reverse, the value of impedance gets lower.
Because of the
difference of the impedance, we can estimate the body fat percentage due to a
lot of experiment data of different people.
B. Principle of
Measurement Method(6)
Usually, the
impedance can be calculated by the following formula.
Z
=k×H/S
(7.6)
where k , H and S represent a
resistivity, a height of a block of tissue and an area of a block of tissue,
respectively.
H
Fig.7.26 Calculation of
resistance of human body
As a result described above, a circuit
model which is shown in Fig.7.27, is used for a human being.
Fig.7.27 A circuit model of human being
V1 = I1(Z1+Z5+Z3) ( The voltage V1 is imposed on Electrode1 and Electrode
3) (7.7)
V2 = I2(Z2+Z5+Z4)
( The voltage V2 is imposed on Electrode2 and Electrode
4) (7.8)
V3 = I3(Z4+Z3) ( The voltage V3 is imposed on Electrode3 and Electrode
4) (7.9)
V4 = I4(Z1+Z2) ( The voltage V4 is imposed on Electrode1 and
Electrode 2)
(7.10)
V5 = I5(Z1+Z5+Z4)
( The voltage V5 is imposed on Electrode1 and
Electrode 4) (7.11)
Firstly, when V1,
V2, V3, V4, and V5 are applied, the currents I1, I2, I3, I4, and I5 are
measured. Then the impedances ( Z1,
Z2, Z3, Z4, Z5) can be
calculated. Therefore, based on the measured
impedances, the fat percentage can be calculated. The detail of this method is
described as follows.
W = FFM + FM
(7.12)
where FFM , and FM represent the weight of body which is not
contained any fat (Fat Free Mass), the weight of fat body (Fat Mass)l,
respectively.
Therefore, FM can be
calculated by using the following formula.
FM = W - FFM
(7. 13 )
Here,
a precise equation is applied for FFM estimation which is shown in the following
formula.
FFM = −4.104 + 0.518Ht2 / R50
+ 0.231weight + 0.130X + 4.229 Gender (7.14)
Where Ht represents height of body,
R50 represents resistance (a voltage of frequency 50kHz is applied),
Weight represents the body weight,
X
represents reactance,
Gender represents an adjustment coefficient (1 for men, 0 for women)
Using formulas (7.13) and (7.14), FM or
fat percentage can be calculated.
This method needs the data of a human height, the weight of a
human body, and the gender for the calculation.
7.6
Urinary Component Detection
7.6.1
Urinary Components and Urinary Sediments
In urinary sediments,
there are many solid substances such as red blood cells, white blood
corpuscles, crystals, casts, epidermal cells and the microbes. If those substances are more than normal value, some
diseases are suspected in kidney or the organ of urinary passage. In the
traditional method, these ingredients are detected by using a microscope. Here,
an automatic method to detect the substance is described. An example of urinary sediment image is
shown in Fig. 7.28.

By urinary sediment analysis, the
following diseases can be known.
1)
If the number of red blood cells in urinary
sediment increases, the following diseases may be
suspected.
Nephritis(kidney inflammation)
Inflammation of urinary system
Nephritic syndrome
2) If the
number of white blood cells in urinary sediment increases,
the following diseases are suspected.
3) If the cylindrical cells(cast) in urinary sediment increase, the following
diseases are suspected.
Nephritic
syndrome
High blood pressure
7.6.2 Detection
method for Urinary Components
There are two methods for
detecting the substances of urinary sediments.
One is the flow cytometry, another
is the image processing.
A. Flow Cytometry(7)
A flow cytometry shown
in Fig. 7.29 is used for detecting substances of urinary sediments. And an example detecting result was
shown in Fig.7.30.
Fig.7.29 Flow cytometry for detection of
urinary sediments
Based on the detected scattergram, the
different substances of urinary sediments can be classified.
FSC FL2 RBC BACT WBC Monocyte Polymorphonuclear Cell
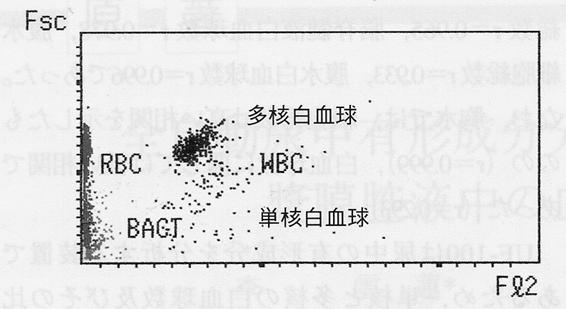
Fig.7.30 Scattergram of
the Flow Cytometry
B. Image processing method for urinary sediments
An image system which is used for
detecting the substances in urinary sediments, is shown in Fig.7.31. Urinary sediment samples are injected
from the top of flow chamber. The urinary sediment combines with a kind of
reagent, then the mixtures flow in flow chamber from top to the bottom.
In
the same time, urinary images are taken by a CCD camera, these images is stored
in an image memory and processed by a computer. There are limitations to detect
the abnormal substances, so the processing algorithms are important to improve
the recognition rate. By using different recognition algorithms(8,9,10),
the abnormal substances such as transparent cast in urinary sediment can be
detected.
An image of
urinary sediment shown in Fig. 7.32 is a transparent cast. Although it is
transparent and very difficult to determine its edge, it can be
recognized after processing by our algorithms. 50 samples of abnormal WBCs and 50 other
no-WBCs are also used for this test, 46
samples of abnormal WBCs can be recognized. The recognition rate is more than
90% by using the neuro-fuzzy method.
Computer: Image
Processing system
![]()
![]()
Fig.7.31 Block diagram of the flow system
The processed result of Fig7.28 is shown in Fig.7.32.
Fig. 7.32 The
processed result image of urinary sediment
7.7
Sensors for Health Management Support System
7.7.1
Importance of Health Management
According to surveys
from
The
leading cause of mortality is cancer, cardiac disease, cerebral vascular as
shown in Fig. 7.33 (there are similar
results in other developed countries.)

![]()
Others 32% 41.6% Others 38.3% 41.6% Pneumonia 9.9% 41.6% Cerebral vascular 11.8% Cardiac Disease 15.9% Cancer 23.1% Cancer 30.4% Cardiac Disease 27.2%

![]()

(a)
Death
rate of
Fig.7.33 The leading cause of Mortality of
U.S.A and
Lifestyle
Risk indicator
Cardiovascular disease& others


Gene
Fig.7.34 Pathogeny of human being
As shown in Fig.7.34, cancer, cardiac disease and cerebral vascular are
caused from Obesity,
Hyperpiesia, Hyperlipidmia, High blood Glucose level. Furthermore, those
symptoms are almost caused from many kinds of
lifestyles. Table 7.1 shows criterions of metabolic syndrome. If a
person meets the criterions which are described as follows, he is diagnosed as
a metabolic syndrome.
(1)
The
waist meets the criterion of 1) item as described in Table 7.1.
(2)
Two
or more of 2), 3), 4) and 5) items as described in Table 7.1 meet their
criterions.
Table 7.1 Criterions
of metabolic syndrome
|
Parameters |
Criterions |
Sensors |
|
1) Waist |
Men >94cm, Women > 80cm |
|
|
2)Neutral fat |
> 150mg/dl |
Laser diode |
|
3)HDL cholesterol |
Men <40 mg/dl, Women <50 mg/dl |
Cholesterol sensor |
|
4)Blood pressure |
Diastolic pressure >85 mmHg Systolic pressure >135mmHg |
Pressure sensor |
|
5) Blood glucose level ( empty belly) |
>100mg/dl |
Glucose sensors |
The first parameter is the waist which is
measured by using a ruler. The second parameter is the neutral fat which can be
measured by using a laser diode. The third parameter is the HDL cholesterol
which can be measured by using a cholesterol sensor. The fourth parameter is
the blood pressure which can be measured by using a pressure sensor. The final
parameter is the blood glucose level which can be measured by using a glucose sensor.
If a person who is in the stage of metabolic syndrome(13) ,
he or she can easily recover by changing her lifestyle into a right lifestyle. Therefore the health management is very
important to our human health. Here, a health management system is described as
follows.
7.7.2
Composition and Principle of Health Management System
Here, a
health management system shown in Fig.7.35 is introduced. This system is
composed of software and four devices which are described as follows:
1) A device for measuring the fat percentage,
the muscle percentage and body weight of human body: This principle is
described in section 7.5 in chapter 7.
2) A device
for blood pressure monitor and cardiac rate: This
principle is described in section 2.2 in chapter 2.
3) A device for
pulse wave: This principle is described in section 7.1 in chapter 7.
4) A device for measuring HGB: This
principle is described in section 7.2
in chapter 7.
5)
The software for health data analysis and providing advices for prevention of diseases
based on human’s health check and his or her lifestyle.
Because it is used for preventing lifestyle disease, all of
devices, which are selected, are non- invasion devices.
Table 7.2 Devices and sensors
|
Devices |
Purposes |
Sensors |
sections |
|
1)Body fat scale |
It is applied for measuring the fat
percentage, the muscle percentage and body weight of human body. |
Impedance sensor |
7.6 |
|
2)Blood pressure Monitor
|
It is applied for measuring the
systolic and diastolic blood pressure. |
Pressure sensor |
2.2 |
|
3) Pulse wave |
It is applied for monitoring the blood
circuit. |
Photo diode sensor |
7.1 |
|
4)Device for HGB |
It is applied for estimating the value
of hemoglobin. |
CCD Camera |
7.2 |
This system is not used for
metabolic syndrome diagnosing. It is used for health management in order to
preventive diseases.
Blood pressure monitor
![]()


![]()
![]()
![]()
![]()
Fig. 7.35 Structure of healthcare management
system
![]()

Fig. 7.36 Flow diagram
for processing of health management.
A flow diagram of the health management system is shown in
Fig.7.36.
(1)In the first step, health check
data are measured using different kinds of devices, which are described above.
(2)In the second step, a group of
questionnaire data of the food analysis and lifestyle, which are provided by
tested people, is input into the computer.
(3)In the third step, the data of
health examination also can be acquisitioned into computer, if the people have
health examination data, which are provided by examination center.
Usually, those data are updated
twice a year, when the people take health examination.
(4)In the fourth step, there
is a preventive medical knowledge database, which can provide different kinds
of advices for difference kinds of people and health conditions.
(5) In the fifth step, the program
of data analysis is executed data processing based on the input data.
Finally, the health management
system program provides some warning information and good advices for your health.
References
(1)Sano Y. et al. The evaluation of blood circulation and its
application based on acceleration plethysmograph, Science of Labor, 61(3),
pp.129-143 (1985)
(2)Toshiyuki Ozawa. ,Kaoru Asano,
Shigehiro Numada, Yasushi Hasui, Yasuhiro Kouchi, Ken Ishihara , Noninvasive Measurement of Hemoglobin
Concentration Using the Near-infrared Spectroscopic Imaging Method. Japanese
medical and Biological Engineering 43(1), pp.93-102 (2005)
(3)Measurement system of glucose, Matsushita technical journal
51(3), pp. 248~253 (2005)
(4)Maekawa Y. ,Sato T. , Okada Seiki, Hagino k. Asakura Y. kikkawa Yasuo, Kojima J. , Omiya K., Takase T.
, Hirakawa M., Uematsu Ikuo, Nawata I. Development of minimal-invasive
self-monitoring system for blood glucose. The 48th Annual conference
of Japan Society for Medical and Biological Engineering, pp.255 (2008)
(5)A.M.
Cenci, M. Maconi, and B. Casolani:Evaluation of the Diagonostic Performance of
the Sysmex XT-2000i Automated Hematology Analyzer in the Detection of Immature
Granulocytes, Sysmex Journal International Vol.15,No1,pp.1-6(2005)
(6)Ursula
G. Kyle, Ingvar Bosaeus, Antonio D. De Lorenzo,Paul Deurenberg, Marinos Elia,
Jos!e
Manuel G!omez,Berit
Lilienthal Heitmann, Luisa Kent-Smith, Jean-Claude Melchior,Matthias Pirlich,
Hermann Scharfetter, Annemie M.W.J. Schols,Claude Pichard, Bioelectrical
impedance analysis part I: review of principles and methods, Clinical Nutrition
23,pp.1226–1243(2004)
(7)UF-100 Clinical Case
Study, TOA Medical Electronics, Scientific Division,
(8)Ningfeng
Zeng, Keiji Taniguchi, Sadakazu Watanabe, Yutaka Nakano, Hiroyuki Nakamoto.
Fuzzy Computation for Detecting Edges of Low Contrast Substances in Urinary
Sediment Images, Medical Imaging Technology, Vol.18, No.3 (2000)
(9)Ningfeng
Zeng, Keiji Taniguchi, Hong Zhu, Sadakazu Watanabe, Yutaka Nakano. Noise
Analysis and Noise Suppression with the Wavelet Transform for Low Contrast Urinary Sediment Images,
Medical Imaging Technology, Vol.18, No.6 (2000)
(10)Ningfeng
Zeng, Keiji Taniguchi, Sadakazu Watanabe, Yutaka Nakano, Hiroyuki Nakamoto. A
fuzzy model for the classification of abnormal substances in urinary sediment
images, Trans. IEE
of
(11)The
homepage of Ministry of Health Labour and Welfare,
http://www.mhlw.go.jp/toukei/saikin/hw/jinkou/geppo/nengai06/kekka3.html
(12)Arialdi
M. Minino, M.P.H; Melonie P. Heron, Ph.D ; Sherry L. Murphy,B.S.; and Kenneth
D.Kochanek, M.A.; Division of Vital Statistics, Deaths: Final Data for 2004,
National Vital Statistics Reports,
August 21(2007)
(13)International
Diabetes Federation. A New world wide definition of the metabolic syndrome,
[ BWW Society Home Page ]
© 2011 The Bibliotheque: World Wide Society